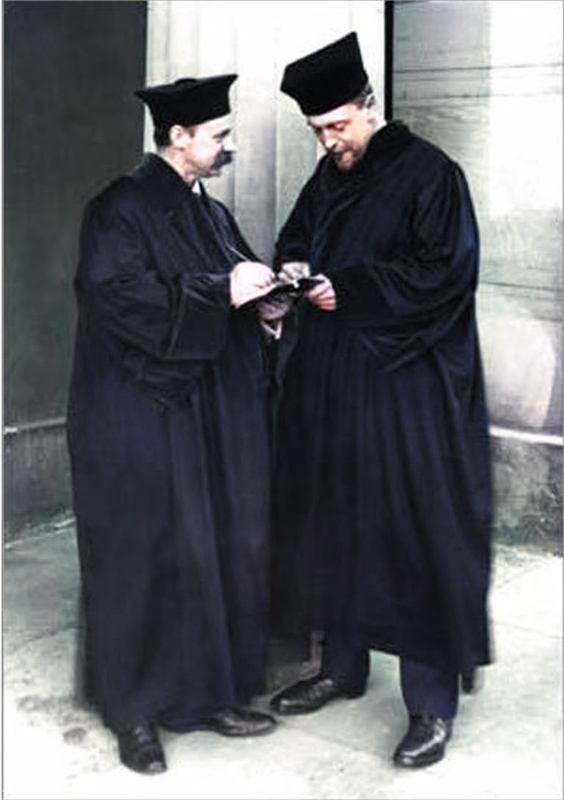
Ejnar Hertzsprung (right) together with Karl Schwarzschild
On October 8, 1873, Danish chemist and astronomer Ejnar Hertzsprung was born. Together with Henry Norris Russell, Hertzsprung developed the Hertzsprung–Russell diagram, a scatter graph of stars showing the relationship between the stars‘ absolute magnitudes or luminosities versus their spectral classifications or effective temperatures, which has become fundamental to the study of stellar evolution.
Ejnar Hertzsprung – Early Years
Ejnar Hertzsprung was probably not formally educated, but studied in technological colleges in Denmark and became a chemical engineer. After graduating in chemistry in 1898, Hertzsprung worked for several years in Saint Petersburg. In 1901 he went to Leipzig to acquire basic knowledge of photochemistry from Wilhelm Ostwald. In 1902 he returned to Denmark and turned to astronomical studies at the University of Copenhagen and at the private Urania Observatory in Frederiksberg. In his papers “Zur Strahlung der Sterne” (On the radiation of stars) published in 1905 and 1907, Hertzsprung showed that a relationship exists between the colours of the stars and their true brightness and that giant and dwarf stars must exist.
On the Radiation of Stars
During the 19th century, large-scale photographic spectroscopic surveys of stars were performed at Harvard College Observatory. They produced spectral classifications for tens of thousands of stars, culminating ultimately in the Henry Draper Catalogue. In one segment of this work Antonia Maury included divisions of the stars by the width of their spectral lines. Hertzsprung noted that stars described with narrow lines tended to have smaller proper motions than the others of the same spectral classification. He took this as an indication of greater luminosity for the narrow-line stars, and computed secular parallaxes for several groups of these, allowing him to estimate their absolute magnitude.
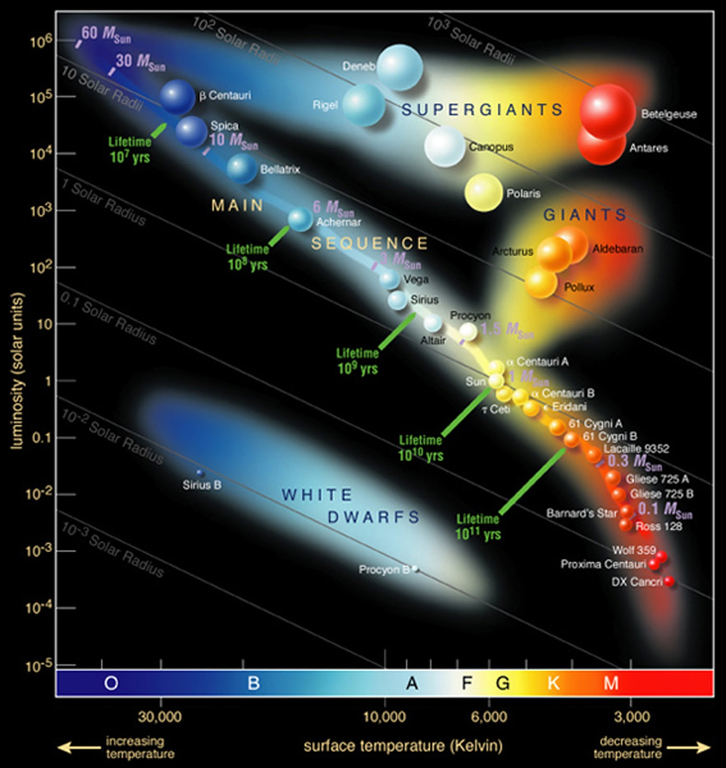
Hertzsprung-Russell Diagram identifying many well known stars in the Milky Way galaxy. Suggested alt-text: Graph of temperature (x-axis) vs luminosity (y-axis). Temperature labels go from 3,000 to 30,000 K, increasing to the left. Luminosity labels increase upward from 10^-5 (0.00001) to 10^6 (one million) Lsun. A “main sequence” of stars from top left to bottom right is seen. At top left they are blue and medium size, at bottom right they are red and small. At top right a number of large stars are shown, from left to right in this region their colors change from blue/white to red. At the very top there is a label “supergiants” and just below that, but above the main-sequence and toward the right of the diagram there is another label “giants”. At bottom left, there is a region labeled white dwarfs, which contains only two tiny stars. On the x-axis, the spectral sequence is also labeled, from left to right: O, B, A, F, G, K, M.
Meeting Karl Schwarzschild
Astronomer Karl Schwarzschild became aware of this young talent and in 1909 arranged an extraordinary professorship for him at the University of Göttingen.[4] Shortly thereafter Schwarzschild moved to the Astrophysical Observatory in Potsdam as director and took Hertzsprung with him as observer. Schwarzschild died in 1916; in addition, the research opportunities for a foreigner in Germany were increasingly limited during the First World War. In 1919 Hertzsprung moved to the Leiden University Observatory (Netherlands), which he headed from 1935 to 1944.
The Diagram
Then in 1910, it was Hans Rosenberg who published a diagram, plotting the apparent magnitude of stars in the Pleiades cluster against the strengths of the Calcium K line and two Hydrogen Balmer lines. The spectral lines serve as a proxy for the temperature of the star, an early form of spectral classification. The apparent magnitude of stars in the same cluster is equivalent to their absolute magnitude and so this early diagram was effectively a plot of luminosity against temperature. The same type of diagram is still used today as a means of showing the stars in clusters without having to initially know their distance and luminosity. Hertzsprung had already been working with this type of diagram, but his first publications showing it were not until 1911. This was also the form of the diagram using apparent magnitudes of a cluster of stars all at the same distance. In 1913, Henry Norris Russell published early versions of the diagram including Maury’s giant stars identified by Hertzsprung, those nearby stars with parallaxes measured at the time, stars from the Hyades, and several moving groups, for which the moving cluster method could be used to derive distances and thereby obtain absolute magnitudes for those stars. Through the years, many forms of the Hertzsprung–Russell diagram developed, and the nomenclature is not very well defined. All forms share the same general layout: stars of greater luminosity are toward the top of the diagram, and stars with higher surface temperature are toward the left side of the diagram.
Further Achievements
Hertzsprung’s research has made important contributions to the development of modern astrophysics. As early as 1905, he defined absolute brightness as a measure of the luminosity of a star. He also discovered that giant stars and dwarf stars can occur with stars of the same surface temperature, thus creating a classification feature. In 1909 Hertzsprung worked on surface temperature-luminosity relationships. To answer the question of whether there are cold and hot luminous stars, he developed a temperature luminosity diagram. In 1911 Hertzsprung discovered small fluctuations in the brightness of the polar star, which enabled him to assign it to the delta cepheids (stars with periodic changes in brightness). In 1913 he succeeded in determining the first distance to Cepheids in the Small Magellanic Cloud. Together with Henrietta Swan Leavitt‘s period-luminosity relationship, distances to distant Cepheids in other galaxies could be determined for the first time.[5] However, the calculated distance to the Small Magellanic Cloud of about 3,000 light years was incorrect. Today we know that the Small Magellanic Cloud is about 70 times further away. Nevertheless, the determination of the distance at that time was an important astrophysical pioneering act. In 1915 Hertzsprung dedicated himself to the double stars, for the observation of which he developed a photographic precision method. In 927 he was elected to the American Academy of Arts and Sciences and in 1929 he was awarded the gold medal of the Royal Astronomical Society. In 1941 he was accepted into the American Philosophical Society.
Ejnar Hertzsprung died inRoskilde, Denmark on 21 October 1967, at age 94.
Stars and Galaxies: The Hertzsprung-Russell Diagram, [9]
References and Further Reading:
- [1] Hertzsprung-Russell Diagram at Britannica
- [2] Hertzsprung-Russell Diagram at the Center for Astrophysics and Supercomputing
- [3] Ejnar Hertzsprung at the Harvard-Smithsonian Center for Astrophysics
- [4] Karl Schwarzschild and the Event Horizon, SciHi Blog
- [5] Henrietta Swan Leavitt and the Light of the Cepheids, SciHi Blog
- [6] Ejnar Hertzsprung at Wikidata7
- [7] Obituaries for E. Hertzsprung in Astrophysics Data System
- [8] Publiations of E. Hertzsprung in Astrophysics Data System
- [9] Stars and Galaxies: The Hertzsprung-Russell Diagram, Conceptual Academy @ youtube
- [10] Hellyer, B. (October 1973). “Ejnar Hertzsprung, 1873–1967”. Journal of the British Astronomical Association. 83: 460–461.
- [11] Timeline of Danish astronomers, via DBpedia and Wikidata

