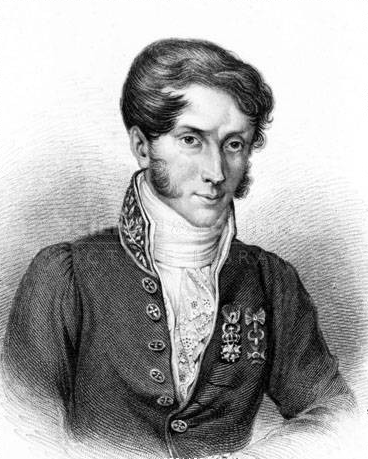
Charles Joseph Minard (1781-1870)
On October 24, 1870, French civil engineer Charles Joseph Minard passed away. He is best noted for his ground breaking inventions in the field of information graphics.
Charles Joseph Minard – Early Years
Charles Joseph Minard was born on March 27, 1781, in Dijon, in the parish of Saint-Michel, France, as the son of Pierre Etienne Minard, a clerk of the court and an officer of the secondary school, and his wife Bénigne Boiteux. He was baptized at Saint-Michel on the day of his birth. At age four Minard learned to read and to write, and when he was six his father enrolled him an elementary course in anatomy. He completed his fourth year of study at the secondary school at Dijon early, and then applied himself to studying Latin, literature, and physical and math sciences. At age 15, he was admitted to the prestigious École Polytechnique, where among his professors among others Lagrange and Fourier made a profound impression on him [1,3,5]. He left there in order to study civil engineering at École nationale des ponts et chaussées (the School of Bridges and Roads).
A Career in Civil Engineering
In September 1810 he was sent by the government to Anvers and then almost immediately to the port of Flessingue. There, he solved a critical problem with a cofferdam that was leaking water faster than it could be removed. He solved the problem by using pumps driven by a steam engine, only the third time this solution had been applied to a project.
He worked for many years as a civil engineer on the construction of dams, canals and bridge projects throughout Europe. On November 1, 1830, he was named superintendent of the School of Bridges and Roads, where he continued to serve through 1836. While there he was awarded the cross of the Legion of Honor. He then became inspector of the Corps of Bridges until he retired in 1851, after which he dedicated himself to private research.

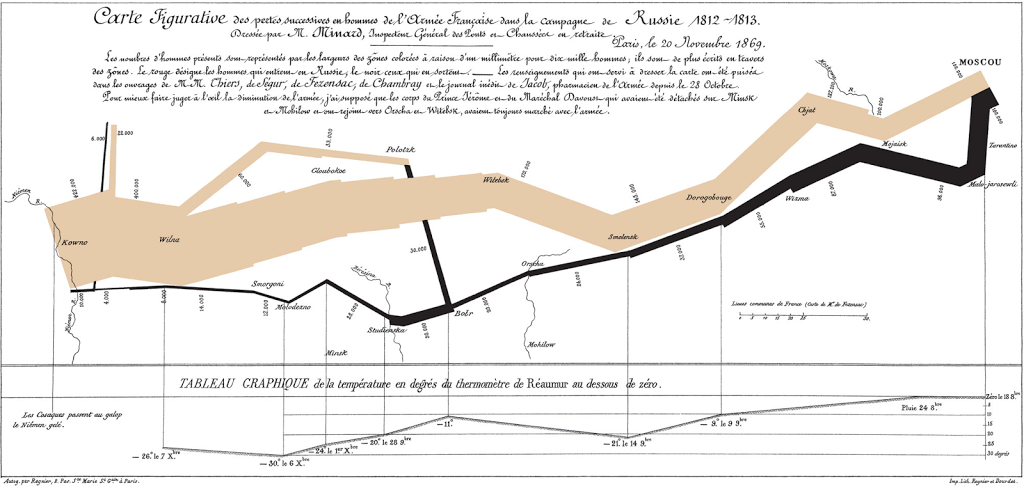
Charles Minard’s map of Napoleon’s disastrous Russian campaign of 1812.
A Pioneer in Infographics
Minard was a pioneer of the use of graphics in engineering and statistics. He first began to publish cartes figuratives (figurative maps) during the mid-1840s, when he was nearly sixty-five years old. Most of his early maps dealt with flows of goods and passengers along railroad, river and oceangoing routes of commerce. Minard’s maps became renowned around France not so much for their statistical or cartographic merits, but for the style he used in visualizing the numerical and relational aspects of flows.[2]
He is most well known for his famous cartographic depiction of numerical data on a map of of Napoleon’s disastrous losses suffered during the Russian campaign of 1812 (Carte figurative des pertes successives en hommes de l’Armée Française dans la campagne de Russie 1812-1813). The illustration is perhaps the single best-known statistical graphic of the nineteenth century and depicts Napoleon’s army departing the Polish-Russian border. A thick band illustrates the size of his army at specific geographic points during their advance and retreat. It displays six types of data in two dimensions: the number of Napoleon’s troops[2,3] This type of band graph for illustration of flows was later named Sankey diagram.

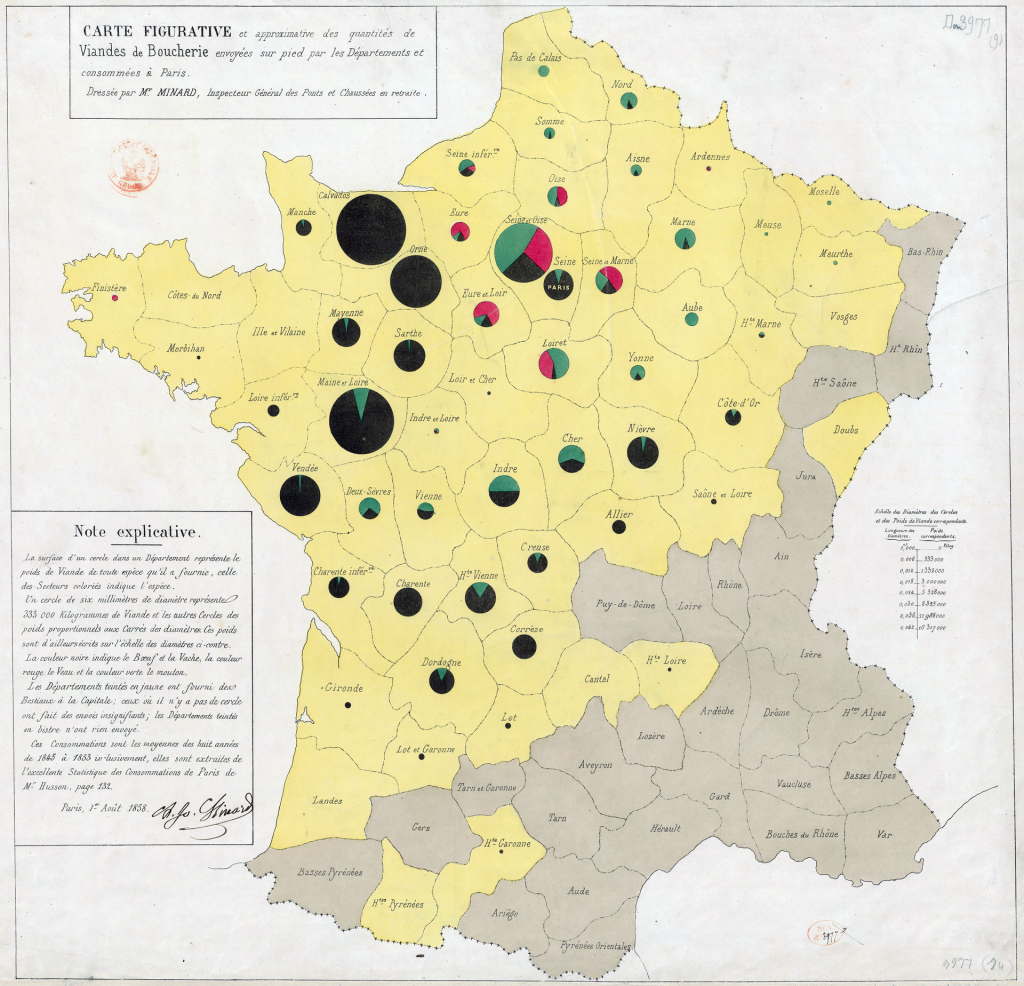
Minard’s map using pie charts to represent the cattle sent from all around France for consumption in Paris (1858)
Later Years
Modern information scientists say the 1869 map of Napoleon’s Russian campaign may be the best statistical graphic ever drawn. French scientist, physiologist and chronophotographer Étienne-Jules Marey praised “its brutal eloquence, which seems to defy the pen of the historian“. Information designer Edward Tufte says it “may well be the best statistical graphic ever drawn” and uses it as a prime example in The Visual Display of Quantitative Information.[3] From 1830 to 1836, Minard directed the École des ponts et chaussées. From 1836 to 1851, the year of his retirement at the mandatory age of 70, he was appointed inspector of bridges and roadways and continued his work on the graphic representation of statistical series throughout his retirement.
The Greatest Ever Infographic – Numberphile, [7]
References and Further Reading
- [1] The Life of Charles Joseph Minard at edwardtufte.com
- [2] Corbett, John: Charles Joseph Minard: Mapping Napoleon’s March, 1861. Center for Spatially Integrated Social Science.
- [3] Edward Tufte: The Visual Display of Quantitative Information. (website)
- [4] Joseph-Louis Lagrange and the Celestial Mechanics, SciHi Blog
- [5] Joseph Fourier and the Greenhouse Effect, SciHi Blog
- [6] “Poster: Napoleon’s March”. Edward Tufte.
- [7] Grime, Dr. James. “The Greatest Ever Infographic” (video). Brady Haran. Retrieved 3 April 2014.
- [8] Charles Joseph Minard at Wikidata
- [9] Chevallier, V. (1871). “The Life of Charles Joseph Minard (1781–1870)”. Finley, Dawn (translator). From “Notice nécrologique sur M. Minard, inspecteur général des ponts et chaussées, en retraite”. Annales des ponts et chaussées (in French). 2: 1–22. 1871.
- [10] Rendgen, Sandra (2018): The Minard System. The Complete Statistical Graphics of Charles-Joseph Minard. New York, Princeton Architectural Press, 2018.
- [11] Michael Friendly (2002). “Visions and re-visions of Charles Joseph Minard.” Journal of Educational and Behavioral Statistics. 27 (1), 31 – 52.
- [12] Timeline of Information Visualization Experts via DBpedia and Wikidata


