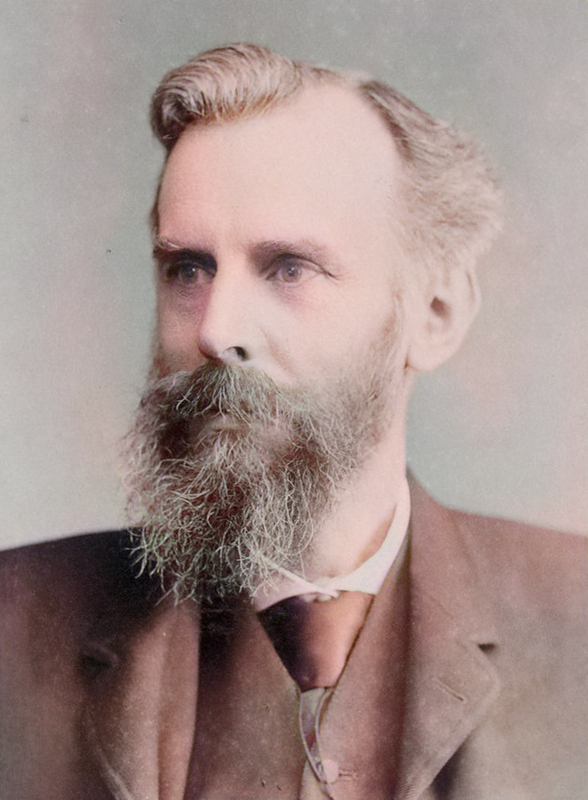
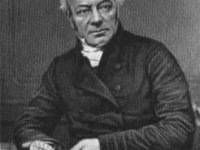
John Venn (4 August 1834 – 4 April 1923)
On August 4, 1834, English logician and philosopher John Venn was born. He is best known for his contribution of the eponymous Venn diagram, used in the fields of set theory, probability, logic, statistics, and computer science.
“I began at once somewhat more steady work on the subjects and books which I should have to lecture on. I now first hit upon the diagrammatical device of representing propositions by inclusive and exclusive circles. Of course the device was not new then, but it was so obviously representative of the way in which any one, who approached the subject from the mathematical side, would attempt to visualise propositions, that it was forced upon me almost at once.”
— John Venn, as quoted in [4]
John Venn – Early Years
John Venn was born in Kingston upon Hull, Yorkshire, UK, as the son of Martha Venn (née Sykes) and the pastor and social reformer Henry Venn. He grew up with two sisters, Henrietta and Susan. His mother died when he was three years old. Venn was descended from a long line of Lutheran clergy, including his grandfather, John Venn Senior, who worked to abolish slavery. John Venn Junior followed his family tradition and became an Anglican minister. He worked first in Cheshunt, Hertfordshire and later in Mortlake, Surrey. Venn attended Highgate School in London. From 1853 to 1857 he studied at Gonville and Caius College in Cambridge. In 1858 he was ordained a deacon in Ely and in 1859 a priest of the Church of England. In 1862 he returned to Cambridge as a university lecturer and under the influence of the work of Augustus De Morgan,[9] George Boole [3] and John Stuart Mill [8] he devoted himself to logic and probability theory.
The Venn Diagram
In 1862, Venn returned to Cambridge as a lecturer in Moral Science and studying and teaching logic and probability theory. It is believed that Venn became more enthusiastic about the field of logic after reading the works of De Morgan, Boole, John Austin, and John Stuart Mill. He also began extending Boole’s mathematical logic and created what he is best known for on this day, his diagrammatic way of representing sets, and their unions and intersections. Venn considered three discs R, S, and T as typical subsets of a set U. The intersections of these discs and their complements divide U into 8 non-overlapping regions, the unions of which give 256 different Boolean combinations of the original sets R, S, T. Keynes later described his new method as very original and a great contribution to the theory of statistics.
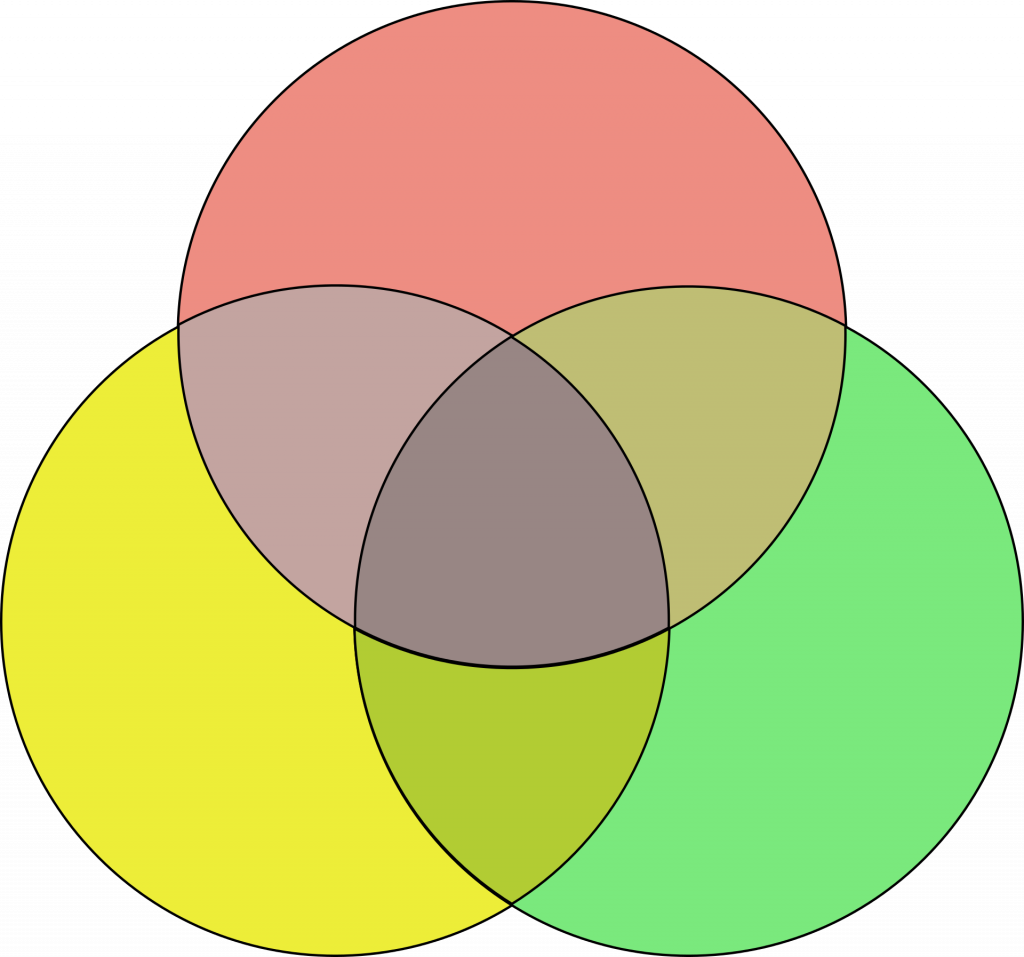
Venn Diagram with three sets
Later Years
In his later career, John Venn was elected a member of the Royal Society and wrote his book ‘The Biographical History of Gonville and Cauis College‘, which was published in 1897. His son, John Archibald Venn became president of Queen’s College, Cambridge in 1932. Together with his son John Archibald Venn he was the editor of the reference book Alumni Cantabrigienses. As professor of logic and natural philosophy Venn taught at Cambridge for over 30 years. From about 1890 onwards, he was primarily concerned with the history of his university. Venn was the first to work out the frequency concept of probability in the form of a mathematical theory. His ideas on probability theory were later taken up and further developed by Hans Reichenbach. Venn also was a prominent supporter of votes for women. He co-signed with his wife Susanna, a letter to the Cambridge Independent Press published 16 October 1908, encouraging women to put themselves forward as candidates for the up-and-coming Cambridge town council elections.
John Venn died on 4th April 1923.
The beauty of data visualization | David McCandless, [12]
References and Further Reading:
- [1] John J. O’Connor, Edmund F. Robertson: John Venn. In: MacTutor History of Mathematics archive.
- [2] John Venn at Famous Mathematicians
- [3] George Boole – The Founder of Modern Logics, SciHi Blog
- [4] Edwards, Anthony William Fairbank (2004). Cogwheels of the Mind: The Story of Venn Diagrams. Baltimore, Maryland, USA: Johns Hopkins University Press. p. 3
- [5] Venn, John (January 1876). “Consistency and Real Inference”. Mind. 1 (1).
- [6] Venn, John (1881). Symbolic Logic. London: Macmillan and Company.
- [7] Obituary of John Venn (New York Times)
- [8] Liberty vs. Authority according to John Stuart Mill, SciHi blog
- [9] Augustus de Morgan and Formal Logic, SciHi Blog
- [10] John Venn at Wikidata
- [11] John Venn at zbMATH
- [12] The beauty of data visualization | David McCandless, TED @ youtube
- [13] Timeline of English Logicians, via Wikidata and DBpedia



Venn diagrams were not invented by John Venn. He himself referred to them as Euler circles.
Pingback: Whewell’s Gazette: Year 03, Vol. #51 | Whewell's Ghost