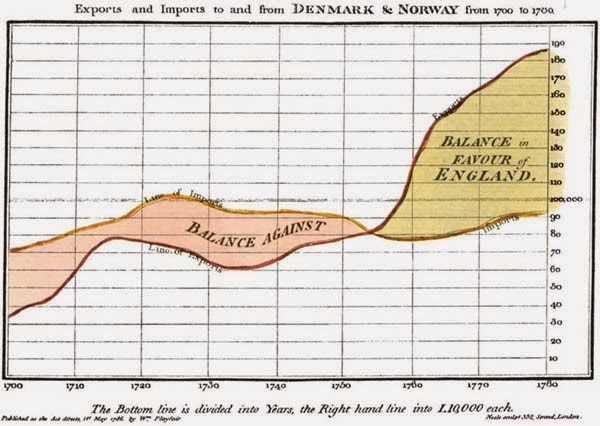
Playfair’s trade-balance time-series chart, from “The Commercial and Political Atlas and Statistical Breviary”, 1786
On September 22, 1759, Scottish engineer and political economist William Playfair was born. He is generally considered the founder of graphical methods of statistics. William Playfair invented four types of diagrams: line graph, bar chart, pie chart, and circle graph.
William Playfair
Playfair was born in 1759 in Scotland during the Enlightenment, a Golden Age in the arts, sciences, industry and commerce. He was the fourth son of the reverend James Playfair of the parish of Liff & Benvie near the city of Dundee in Scotland. His notable brothers were architect James Playfair and John Playfair, Professor of Mathematics and later Professor of Natural Philosophy at the University of Edinburgh. His father died in 1772 when William was 13, leaving the eldest brother John to care for the family and his education. His early taste for mechanics prompted his friends to place him as apprentice to a mill-wright Andrew Meikle, the inventor of the threshing machine. But, this is were William Playfair’s multifaceted career should only start. He was in turn a millwright, engineer, draftsman, accountant, inventor, silversmith, merchant, investment broker, economist, statistician, pamphleteer, translator, publicist, land speculator, convict, banker, ardent royalist, editor, blackmailer and journalist.
Playfair and James Watt
In 1780, he went to England, was engaged as draftsman and personal assistant of the inventor James Watt at the steam engine manufacturing works of Boulton & Watt in Birmingham in 1777, where he received a scientific and engineering training. Among the most useful of his mechanical efforts, was the unrequited discovery of the French telegraph, gathered from a few partial hints, and afterwards adapted by an alphabet of his own invention to British use. [1] On leaving Watt’s company in 1782, he set up a silversmithing business and shop in London, which failed. In 1787 he moved to Paris, taking part in the storming of the Bastille two years later. He returned to London in 1793, where he opened a “security bank”, which also failed. From 1775 he worked as a writer and pamphleteer and did some engineering work.
Infographics
Playfair’s main achievement lies primarily in his innovations in the presentation of quantitative information by means of graphs and charts. But, he was not the first to come up with the idea. Already in 1765, Joseph Priestley had created the innovation of the first timeline charts, in which individual bars were used to visualize the life span of a person to compare the life spans of multiple persons. These timelines directly inspired Wiliam Playfair’s invention of the bar chart, which first appeared in his Commercial and Political Atlas, published in 1786. Actually, Playfair was driven to this invention by a lack of data. He had collected data about the import and export from different countries over the years, which he presented as line graphs. Because he lacked the necessary series data for Scotland, he graphed its trade data for a single year (1781) as a series of bars, one for each of Scotland’s trading partners.[4]
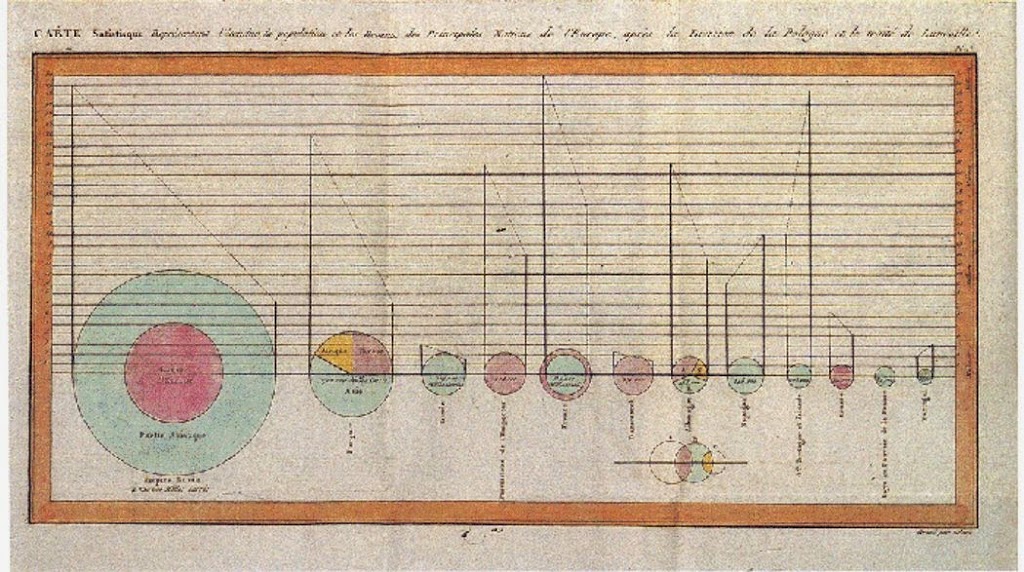
Playfair’s Pie Charts from “The Commercial and Political Atlas and Statistical Breviary”, 1786
Playfair, who argued that charts communicated better than tables of data, has been credited with inventing the line, bar, and pie charts. His time-series plots are still presented as models of clarity. Playfair first published The Commercial and Political Atlas in London in 1786. It contained 43 time-series plots and one bar chart, a form apparently introduced in this work. It has been described as the first major work to contain statistical graphs. Playfair’s Statistical Breviary, published in London in 1801, contains what is generally credited as the first pie chart. He was the first to use hachure, shading, and color, thus incorporating elements of classification into the quantitative depiction. The quality and detail of his work was such that in the two centuries since there has been no appreciable improvement of his basic designs. [5]
Influence
After the Bourbon restoration in France, William Playfair returned to Paris, where he edited a journal called Galignani’s Messenger. He had to flee the country a second time when prosecuted for libel, and thereafter spent his time writing in London, where he died at the age of 64. Playfair has invented a universal language useful to science and commerce alike and though his contemporaries failed to grasp the significance, he had no doubt that he had forever changed the way we would look at data. However, it took almost a century after his death before his invention was fully accepted. [5]
Hans Rosling: Let my dataset change your mindset, [6]
References and Further Reading
- [1] William Playfair, from Significant Scots, ElectricalScotland.com
- [2] James R. Beniger and Dorothy L. Robyn (1978). “Quantitative graphics in statistics: A brief history”. In: The American Statistician. 32: pp. 1–11.
- [3] John Venn and the Venn Diagram, SciHi Blog
- [4] Charles Joseph Minard and the Art of Infographics, SciHi Blog
- [5] William Playfair at Wikidata
- [6] Hans Rosling: Let my dataset change your mindset, TED @ youtube
- [7] Ian Spence and Howard Wainer (2001). “William Playfair”. In: Statisticians of the Centuries. C.C. Heyde and E. Seneta (eds.) New York: Springer. pp. 105–110.
- [8] Ian Spence (2005). “No Humble Pie: The Origins and Usage of a statistical Chart”. In: Journal of Educational and Behavioral Statistics. Winter 2005, 30 (4), 353–368.
- [9] Timeline of Information Visualization Experts via DBpedia and Wikidata


I like this website because it give me time to know about history and i really love why did william Henry playfair wanted to make line graph, pie chart, and bar graph to help us
Pingback: Klasiķi - manipulātori - Datu Skola
Pingback: Klasiķi – manipulātori – DatuSkola
Pingback: Data Visualization Techniques and Best Practices to Tell Your Data’s Story | Sigma Computing